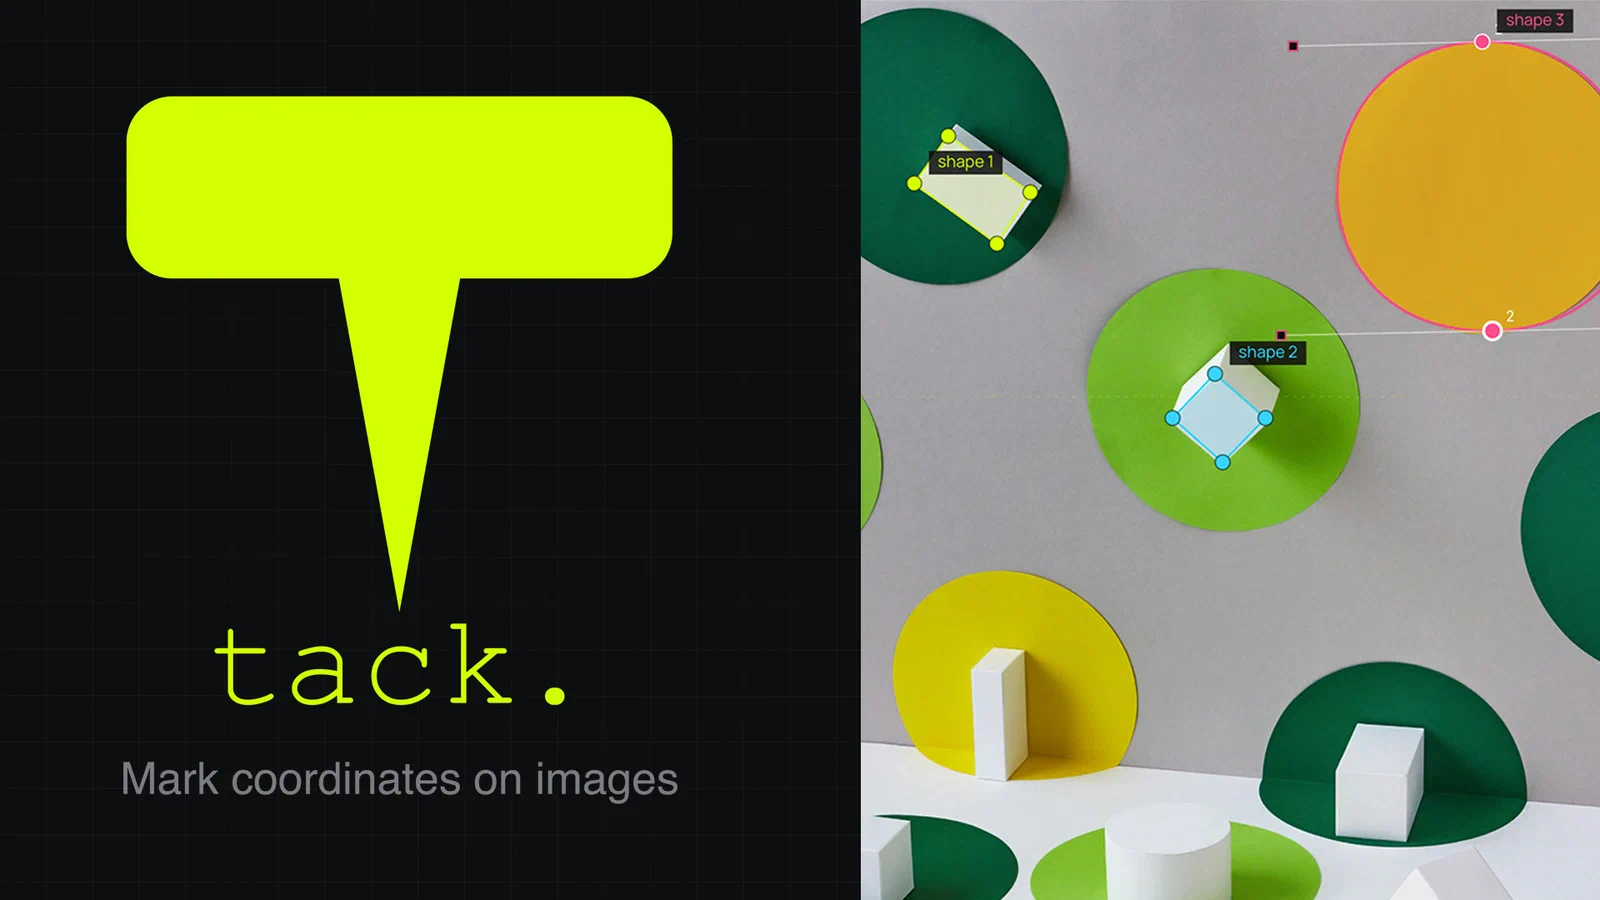
tack.pics: Pin Coordinates Onto Any Image
A walkthrough of tack.pics — a free, browser-based tool for marking points and polygon regions on images and exporting them as JSON or YAML. Useful for game collision shapes, ML annotation, hotspot maps, and anywhere else you need pixel-precise data.
What started as a Saturday-afternoon utility for placing collision shapes on a sprite turned into tack.pics — a small, free, browser-based tool for marking points and polygon regions on images and exporting them as JSON or YAML. Drop in an image, click out the coordinates, drag bezier curves where you need them, and copy the data straight into your code. Nothing leaves your device.
In this post I’ll walk through what the tool does, where it’s useful, and a couple of decisions that ended up shaping the experience.
What it does
The workflow is unapologetically simple:
- Drop in an image — PNG, JPG, GIF, or WEBP. The image is read into the browser via the File API; it is not uploaded anywhere.
- Click to place corner anchors. Click-and-drag instead, and you get a smooth anchor with bezier handles you can adjust afterwards.
- Repeat for as many shapes as you need. Single points, open polylines, closed polygons — mix all three on one image.
- Pick an origin and a coordinate system. Top-left, top-right, bottom-left, bottom-right, center, or click anywhere on the image to set a custom origin. Flip the Y-axis. Switch between absolute pixels and normalized 0–1 coordinates.
- Press Generate. The output panel shows the JSON (or YAML) for every shape you’ve drawn. Copy it, download it, paste it into your project.
The whole thing fits on a single screen. No accounts, no projects to “create”, no save dialogs. The tool is the page.
Why I built it
The tools I’d been using fell into two camps: heavyweight image editors with plugin systems, and one-off scripts that produced the right data format but needed me to run them locally. Both felt like more friction than the task deserved. I wanted to be able to send a teammate a URL, have them mark a few hit zones on a sprite, and paste the result into a Slack message ten seconds later.
That target — “ten seconds from URL to clipboard” — drove most of the design decisions:
- No upload. Loading is instant and the privacy story is trivial: the image stays in your browser. There’s no server to keep up.
- No login. Same reasoning. Nothing to forget, nothing to leak.
- No project files. Just the image and a JSON/YAML output. If you want to edit later, load the JSON back in — round-tripping was a hard requirement.
- Keyboard shortcuts everywhere. N for new shape, C to close a polygon, ⌘Z / ⇧⌘Z (or Ctrl+Z / Ctrl+Shift+Z on Windows) for undo and redo, arrow keys to nudge the selected anchor by 1px (Shift for 10px). The pop-out shortcut panel lives in the sidebar.
Where it’s useful
I’d been thinking primarily about 2D game collision boundaries when I started, but as soon as I had a working prototype I realised the same tool covers a lot of nearby use cases:
- Hit zones for click / tap targets on UI mockups.
- Pathing waypoints for game AI.
- Spawn points and triggers in level layouts.
- Hotspots on interactive maps.
- Annotation regions for ML training datasets.
- Image-based UI layout coordinates.
- Sprite anchor points.
- Region-of-interest extraction for image processing.
- Floorplan and blueprint markup.
Anywhere you need to translate “where is this thing in this picture” into a list of coordinates, the tool fits. The output is intentionally simple JSON, so wiring it into whatever engine or framework you’re using is usually a few lines.
Bezier curves
Polygons are useful, but a lot of real-world shapes — character silhouettes, organic terrain, curved hit boxes — aren’t well-described by straight lines. So tack supports proper bezier curves on every anchor:
- Click places a corner anchor.
- Click and drag places a smooth anchor and extends two symmetric handles in the direction you drag.
- Drag a handle to reshape the curve on either side of the anchor.
- Alt-drag a handle breaks the symmetry, so you can have a sharp incoming curve and a soft outgoing one at the same anchor.
- Shift-drag re-syncs the two handles after you’ve broken symmetry.
- Alt-drag an anchor that has no handles converts it to smooth and pulls handles out from it.
- Double-click an anchor toggles smooth ↔ corner.
It took a few iterations to find a model where corner and smooth points feel distinct without making the interaction modal. The current version sticks close to how vector tools like Figma and Illustrator behave, which is what most people expect.
Coordinate systems
The other thing I cared about was getting the coordinate output right without forcing the user to post-process anything. Different engines and use cases want different conventions:
- Origin can be any of the four corners, the center, or a custom point you click on the image. That last one is essential for sprite anchor work.
- Y-axis flips between “down” (screen / canvas coordinates) and “up” (math / OpenGL coordinates).
- Units toggle between absolute pixels and normalized 0–1 coordinates. Normalized is what you want when the image will be displayed at multiple resolutions.
All four corner-presets, the center, the custom origin, the Y-axis flip, and the units switch take effect live — the output regenerates as you change them, so you can see the deltas.
Round-tripping JSON
The “Load Data” button takes existing JSON output and reloads it into the tool. That sounds obvious in retrospect, but it was the single feature that moved tack from “useful for one shot” to “useful as part of an actual workflow”. You can export JSON, commit it to your game repo, then a month later open the image up in tack again, click Load Data, and pick up exactly where you left off — including the bezier handles.
Privacy and analytics
Because everything runs locally, the privacy story is short: your images and your coordinate data never leave your device. The only data the site collects is anonymous, cookie-less page-view counts via a self-hosted Umami install — no per-button telemetry, no session recording, no cross-site tracking. The full privacy statement and terms are linked from the footer.
Technical stack
For anyone curious about the implementation:
- Vanilla JavaScript with the Canvas API. No framework. The whole tool is a single self-contained IIFE — no bundler beyond Hugo’s minify and fingerprint pipeline.
- Hugo as the static site generator for the surrounding pages (privacy, terms, credits, offline fallback) and the SEO content section below the tool.
- TailwindCSS 4 for the marketing content. The tool itself uses scoped plain CSS so it doesn’t carry the framework with it.
- PWA — installable, with a service worker that pre-caches the app and the legal pages so it works offline once visited. Pre-cache uses fingerprinted assets and a stale-while-revalidate strategy for HTML.
- Cloudflare Pages for hosting.
The tool is a desktop / tablet experience by design — marking pixel-precise points and pulling bezier handles needs more room than a phone gives — so narrow viewports show a “best on bigger screen” notice with the SEO content still readable below.
Try it out
If you make games, label datasets, build interactive maps, or just need a list of coordinates from a picture, give it a spin: tack.pics
Free, runs in your browser, works offline once installed. Feedback always welcome.